
Set Your Mind Free with Pen and Paper
Receive free IIBA updates and exclusive content!

I have never been good at drawing or considered myself to be artistic. But out of curiosity, I took a day one class in hand drawn visualizations. The topic of the class was how to create engaging presentations, it was cheap and a chance to get out of the office for a day. After that class, I felt like my mind had been liberated. Free of the constraints of a computer application telling me what shapes and colours I can use. A connection between my mind and my hand. My hand, that is fully controlled by me and not how the keyboard keys have been programmed. This was about 10 years ago. Over those years I have gradually developed my visual thinking practice and today it is tightly integrated with my ways of working. What kept me interested over the years and convinced me that it was not a matter of how artistically I can draw was this feeling of liberation. This article is about integrating visualizations in pen and paper into your BA practice and your daily work. Whether they consist of drawings, text or shapes is less relevant - the main point is: Pen and paper.

This is not about teaching a visual alphabet, how to develop icons and metaphors or how to improve your lettering. Learning these skills - that is, establishing your visual toolbox - is an important prerequisite, and there are many professionals who offer cheap, or even free resources, that can teach you that.
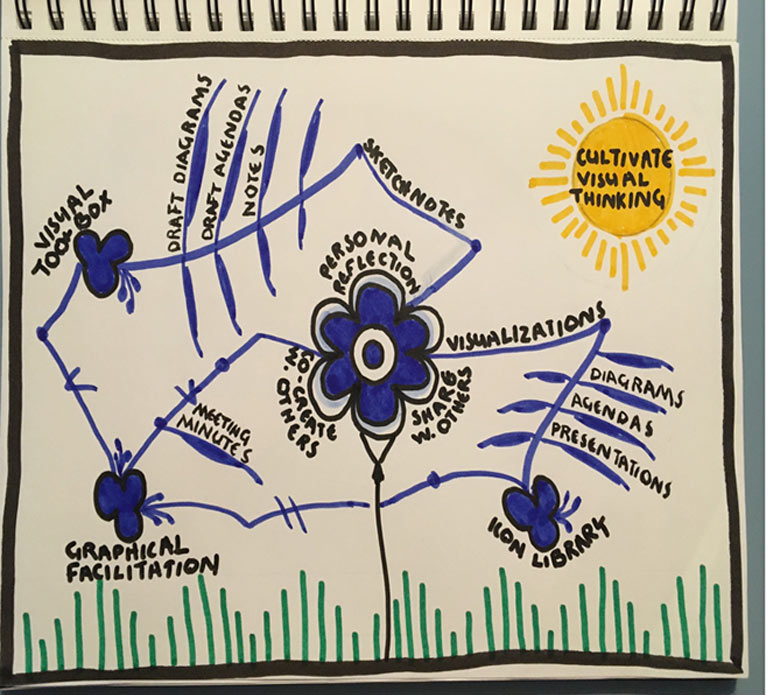
My journey is visualized below. This was the first time I have drawn a flower, so now I have added that to my icon library for use some other time. It is inspired by the pattern on some plates that I have. It is a very classic Danish design and I like to use designs that also tell something about me or my colleagues’ cultural heritage (I have used the Lego brick several times). The structure is essentially a mindmap.
Visualizing for personal reflection
The three techniques below are all about practicing the tools in your visual toolbox: visual alphabet, lettering, containers, and connectors and getting to know your markers. You do not need to share your drawings with a single person if you feel uncomfortable about that.
Once you get started working by hand, you might discover what I initially - very unexpectedly - thought was quite intimidating. When sitting in an open, shared office space, everyone can see what you are doing, when you sit at your desk drawing. When using PowerPoint or Visio, you can sit forever with the formatting and alignment, but no one sees. I used to wonder what people thought of me knowing that they can see me making an effort to get letters on a straight line and changing between a blue and a red marker. I know the truth is that I would spend at least as much time formatting a Visio diagram or a PowerPoint slide, the only difference is that no one sees it. This turned out to be a real exercise in courage.
1. Draft your diagrams by hand
Developing diagrams is a well-established practice in the IT industry. If you use diagrams - even if you “just” follow a formal standard like BPMN or UML - then voila, you are already a visual practitioner.
For many years, I would draft diagrams by hand, and then create the version to share with others in PowerPoint or Visio (or whatever else you use). Even diagrams that follow a standard format, such as process diagrams, ER diagrams, use case diagrams etc. The more I practiced this, the easier it was for me to just get something down on paper without caring too much about following the modelling standard. That allowed me to identify the right elements and their relation, see patterns and identify actors and this minimized the rework I had to do digitally.
2. Make a handwritten plan for the week
For a while, the first thing I would do on Monday morning was to start a plan for the week. I would add a headline (which allowed me to practice large lettering) and a frame (allowing me to practice that element as well). I would use a new color each week as a way to get familiar with all my markers. Then I would add the things I could think of and during the week, I would add additional tasks and mark the tasks I had completed. Sometimes I would also add things that needed my attention in general. When I had time, I would try to come up with icons for some if the topics on my plan. This was a safe and easy way for me to make sure that I applied visual thinking continuously.
3. Use handwritten mindmaps for notes
Mindmaps are a familiar and well documented format and easy to get started with when it comes to taking notes by hand. As you get more familiar with this, you can start experimenting a little more with the format, add colors, add containers and connector elements and icons. These elements can be used for emphasis and describe relations or patterns.
Visualizing for sharing with others
At this point, you have established your basic toolbox and the next step you need to take is to create an icon library. As you create content, you need to add the icons you come up with to a repository of the icons you use so you can easily reuse them. When you create pre-prepared graphical content, you have time to work out which icons to use. By creating a library, you will have 80-90% of the graphical content that you need when creating an illustration. To really integrate visual practice into your daily work, you can make a rule that you have to create a visualization at least twice every week (as an example). This forces you to consider what can actually be visualized using pen and paper.
4. Do your meeting agenda by hand
As a business analyst I am also the product owner of an offshore development team and my collaboration with the team is to a large extent centered around a weekly product backlog refinement meeting. The first thing I do after a product backlog refinement meeting is to start the agenda for next week’s meeting on a piece of paper. I work on that agenda throughout the week and add conclusions and scope to it. It then functions as my plan for the week. Before the meeting, I will then write up the final agenda and add some main points that I want to communicate with the team and preferably also some visual elements such as icons for emphasis. Working with a remote team, I like to think that this is also a way for me to express a bit more personality. Having written notes in the mindmap format, this is a natural next step - a mindmap that can be read by others than yourself.
5. Replace PowerPoint content with hand drawn content
I rarely create actual content in PowerPoint. I prefer to create a visualization on paper using pens and markers. Then I scan it and paste the image into PowerPoint. I find that this way, I reduce the number of slides and improve the quality of the content I present. In other words, it forces you to keep it simple and to the point. My slides are no longer my notes for what I want to communicate but visualizations that support my message. Is it not more time consuming, you might ask? Not really. As mentioned, the number of slides can go down, and once you start using pen and paper, you realize how much time you actually spend on formatting, aligning etc. when creating slides. These visualizations can also replace the early stages of a formal diagram, where it serves more as a starting point of a dialogue than actual documentation. Who says, you cannot draw up the first 5 versions of a BPMN process flow by hand?
Sometimes, when I talk to stakeholders to understand a particular domain, I draw my understanding of what they have told me in a draft sketching out users, activities, basic concepts. Where I see incoherence or have doubts, I will add text and questions in pencil that can be erased later. Then I share it with the stakeholders, get their feedback and add and refine until we have a shared understanding. In my experience, the people I work with give fast and accurate feedback when we work like this.
Visualizing for co-creating with others
Once you have your icon library, you are ready for “live” creation of content.
6. Graphical meeting minutes
On your mindmap agenda, you need to make space for adding notes to each topic on the agenda. This you can do during the meeting, and then spend 10-15 minutes after the meeting to add visual effects (colours, frames, connectors for emphasis and meaning) and icons. With this approach you do not need to rewrite your notes to process them. This can then be scanned and distributed to the participants. This is essentially a small-scale graphical recording.
I recommend this for meetings of less formal character but where you still need to make sure you have a shared picture of the output. In some situations, it is important to have a very formal document with the minutes of the meeting.
I hope this article has illustrated how you can be a visual practitioner without being a professional graphic facilitator. In knowing your organization and the business domain, you have a major advantage over a professional visual practitioner, who may be much better at drawing and know artistic lettering styles, but remember that you can come up with ideas for icons, metaphors and visuals in no time. You already have them in your icon library.
Visual Thinking skills coupled with Product Ownership Analysis (POA) can empower Business Analysis professionals with standards, practices, techniques and competencies to create value and better business outcomes. Learn more about POA in the Guide to Product Ownership Analysis.
Interested in more on Visual Thinking? Watch IIBA's Visual Thinking Superpowers for Product Ownership webinar on-demand here.
Product Ownership Analysis - What You Need to Know
Guide to Product Ownership Analysis
As organizations transition from project-centric models to a product-centric view, it is important to understand how product ownership is evolving and how business analysis professionals can drive the delivery of successful products.
Key Features Include:
- Integrating product ownership and business analysis
- Understanding roles and responsibilities in product management
- Applying Agile and product ownership analysis
- More than 50 case study examples
- Over 25 techniques for applying POA
Uncover the framework, context, techniques, and competencies that can give you an advantage.

About The Author:

Line Karkov, is a CBAP with 14 years of business analysis and product owner experience working with internal development organizations in large, old, complex companies. Over the past couple of years, she has increasingly applied visual thinking. This has had a significant impact on how Line communicates and processes information. This blog is about her journey and shares how you can apply visual thinking to business analysis.